Finding the OEP and Dumping the Payload
It is a 32-bit binary. Keep it in mind, we will use it later.

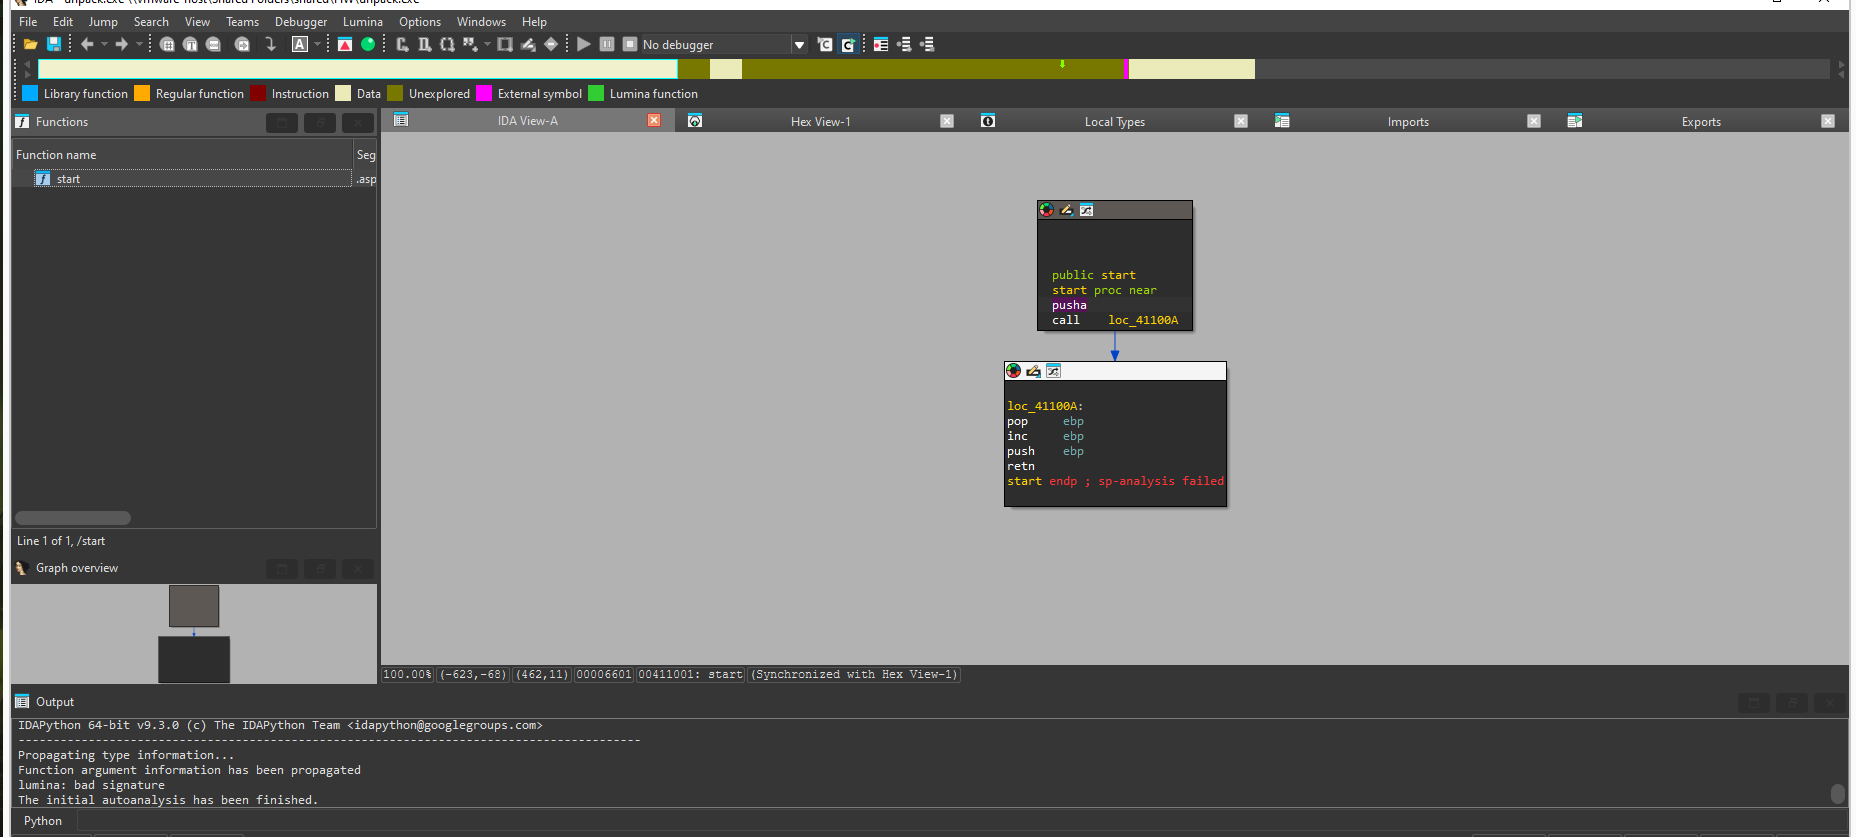
Let’s kick things off by tossing the binary into IDA Pro. Right out of the gate, we notice something suspicious: it only has one tiny function, and the code footprint is incredibly small. That’s a classic red flag and a clear sign that we’re dealing with a packed executable.
Time to get our hands dirty. We fire up x32dbg (as you saw earlier, we are dealing with PE 32 bit) to hunt down the Original Entry Point (OEP), the holy grail where the unpacker stub finishes its job and hands control back to the actual payload.
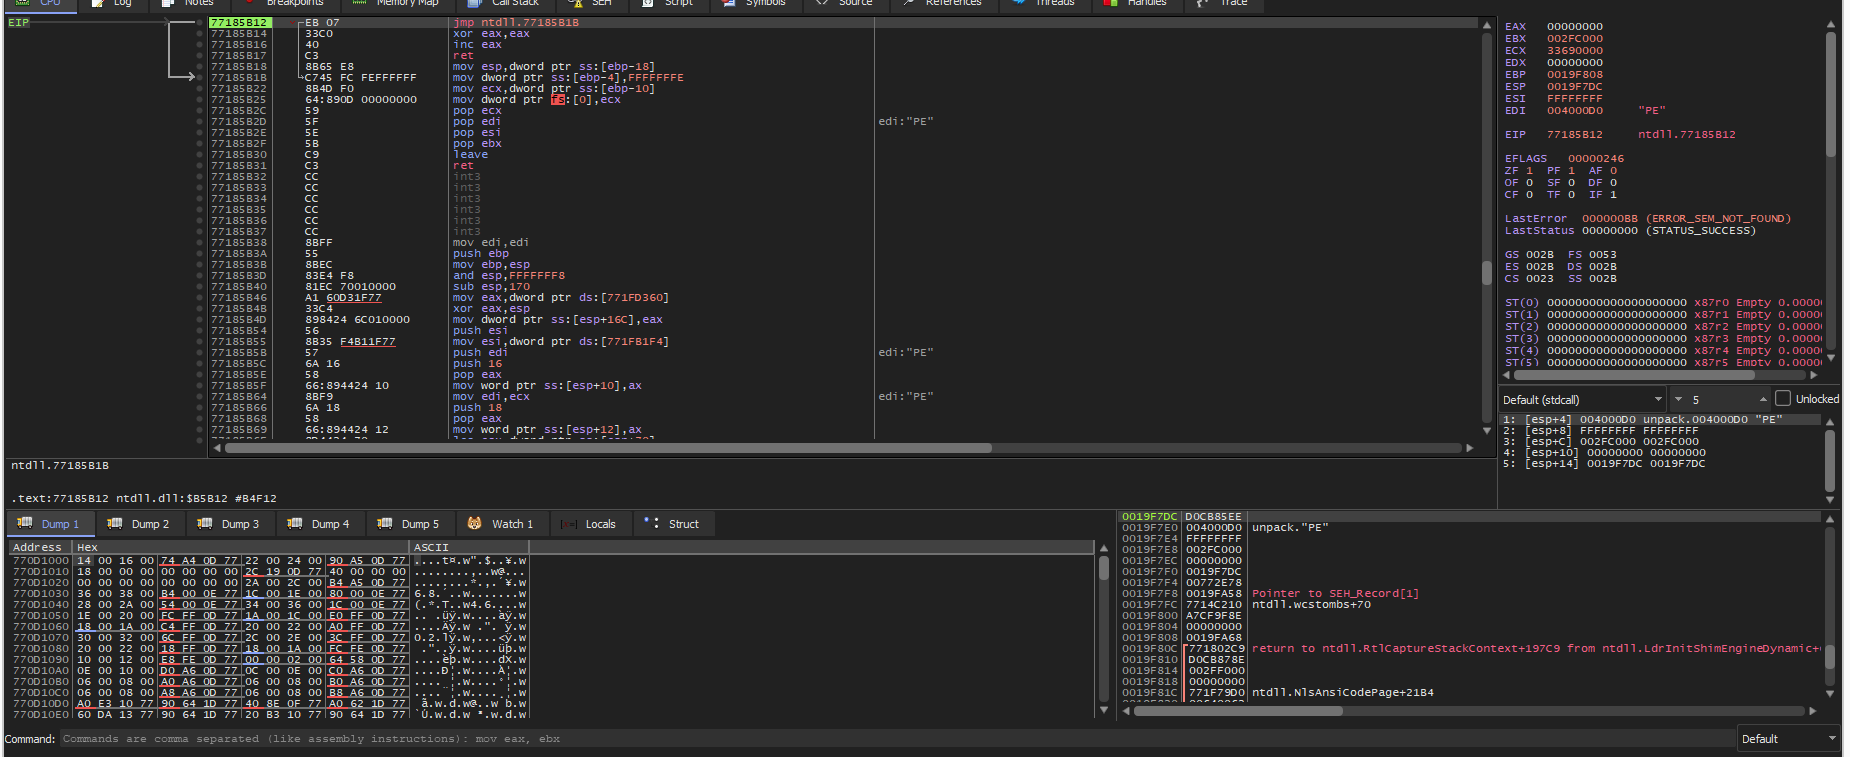
When we first attach, we might find ourselves lost in the weeds of Windows OS functions, staring at a lot of ntdll modules. We don’t want to waste time reversing Microsoft’s code, so we need to escape back to userland. A quick restart and run (Ctrl+F2 followed by F9) gets us back on track.
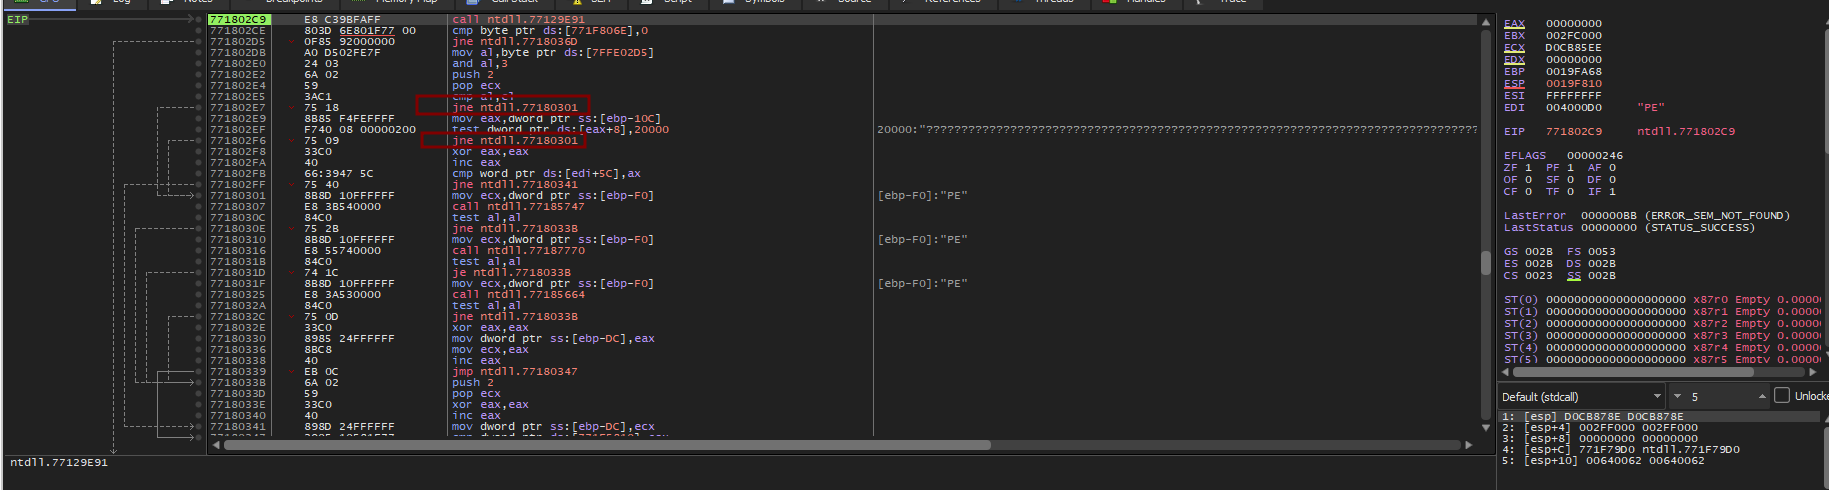
Now we’re talking. Scanning the assembly, we spot a beautiful pushad instruction. Packers love using pushad to save all the general-purpose registers onto the stack before they start decrypting or decompressing the real payload. Logically, once the unpacking routine is finished, it has to restore those registers using popad right before jumping to the OEP.
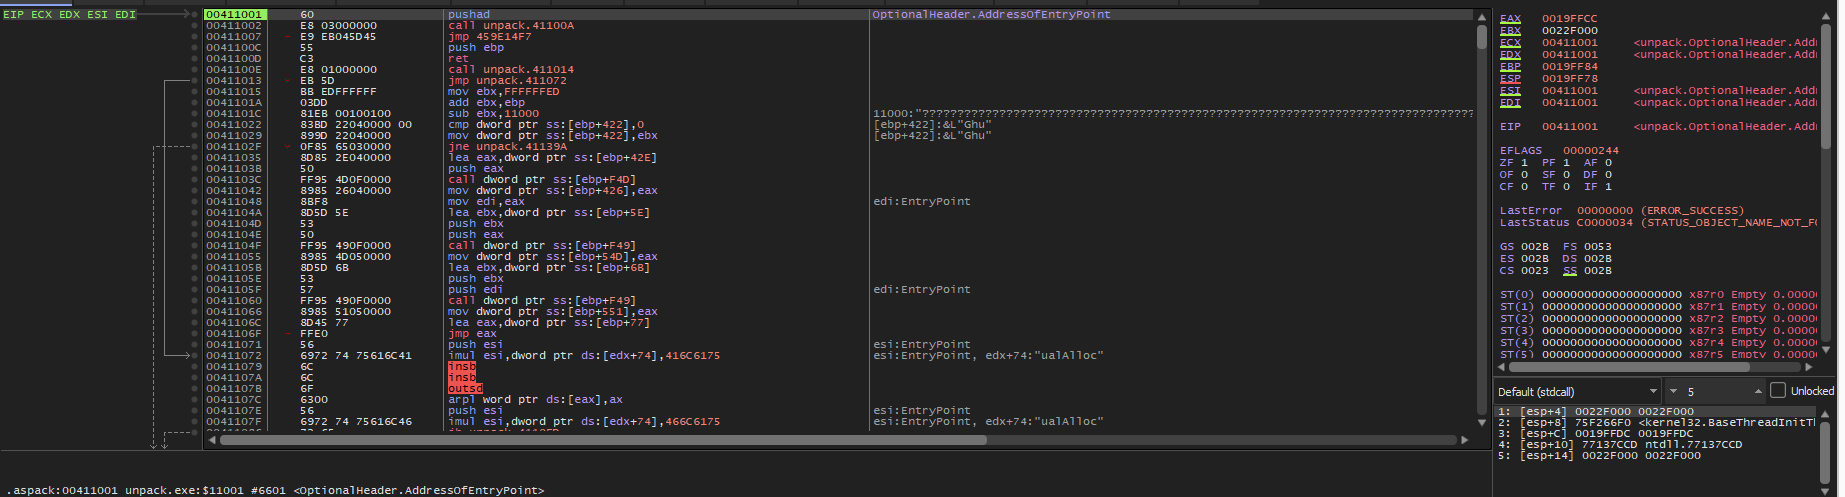
Here’s the trick: if we monitor the exact stack address where those registers are saved, we can catch the unpacker right as it calls popad to retrieve them. So, we select the ESP register, right-click, and hit “Follow in Dump”.
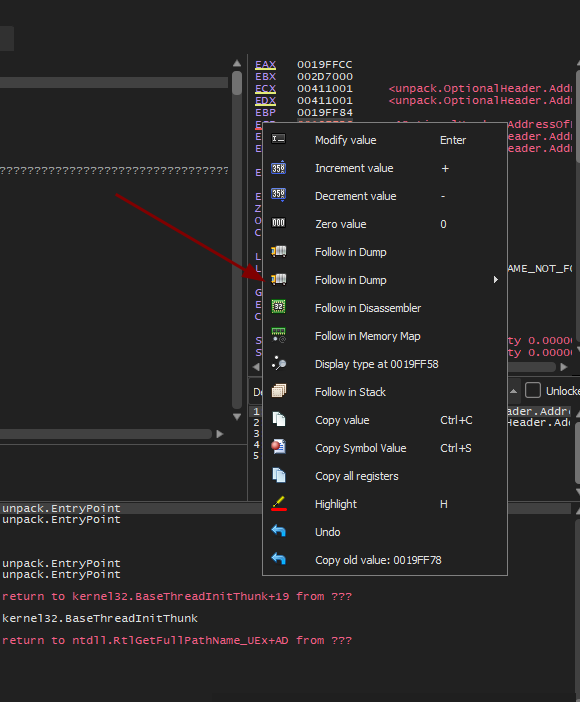
This is the location in stack we are interested about:
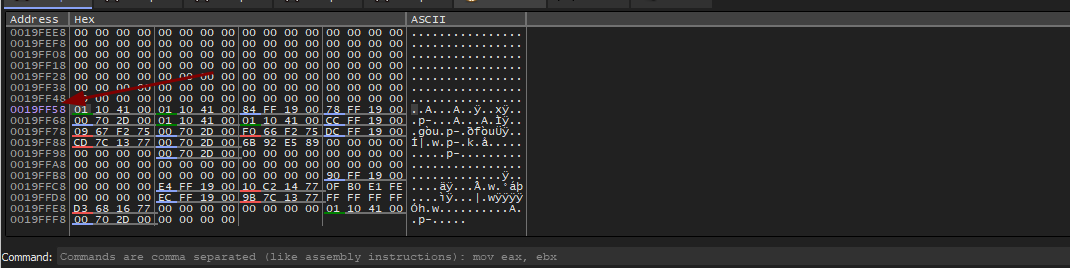
Next up, we set a Hardware Breakpoint on those specific bytes in the dump. Why hardware over software? Software breakpoints patch the code with an interrupt (INT 3), which is a massive, noisy indicator that a debugger is present. Modern malware often checks for these modifications to detect our analysis and hide its true behavior. Hardware breakpoints, on the other hand, use the CPU’s debug registers, leaving the memory untouched and keeping our analysis stealthy. We set the condition to trigger on memory “Access” because we want the debugger to snap the exact moment the popad instruction tries to read from this stack location.
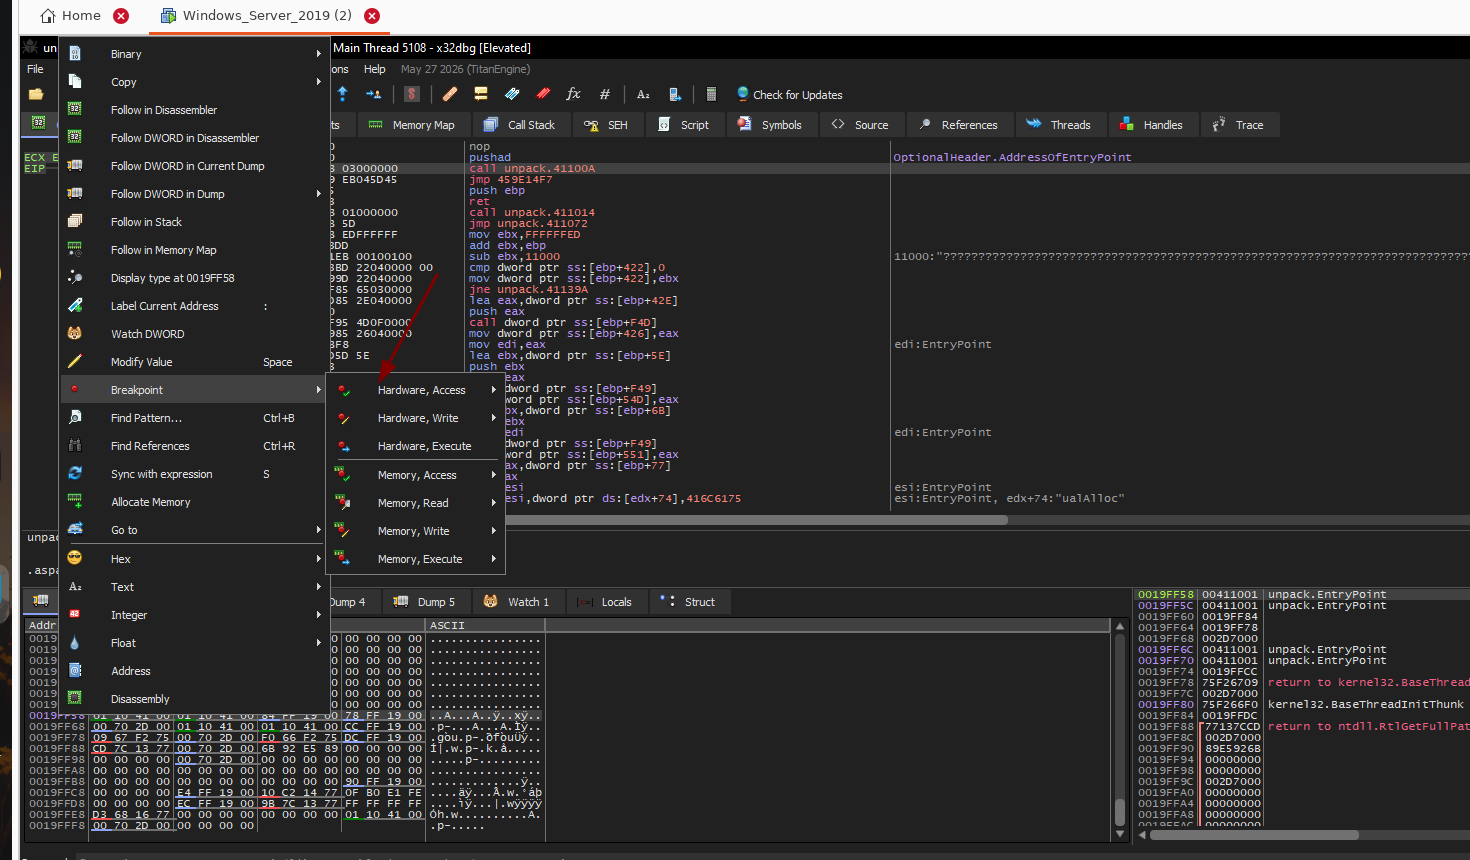
We use this access option, as we want to access the stack again later.
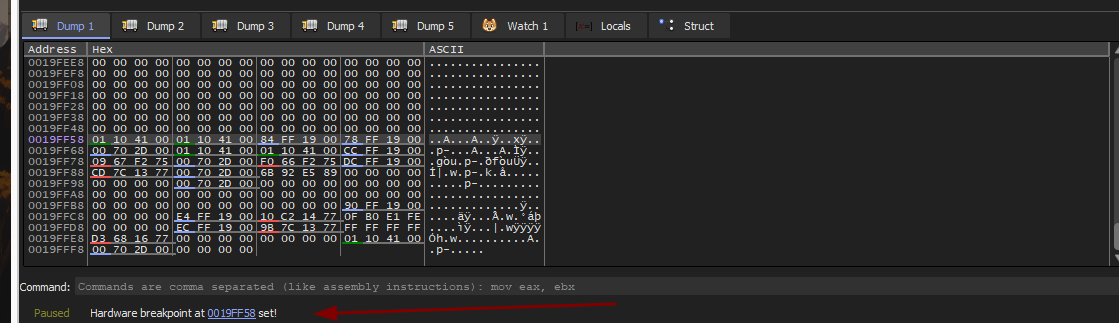
With the trap set, we hit F9 (Run) and let the unpacker do its thing.
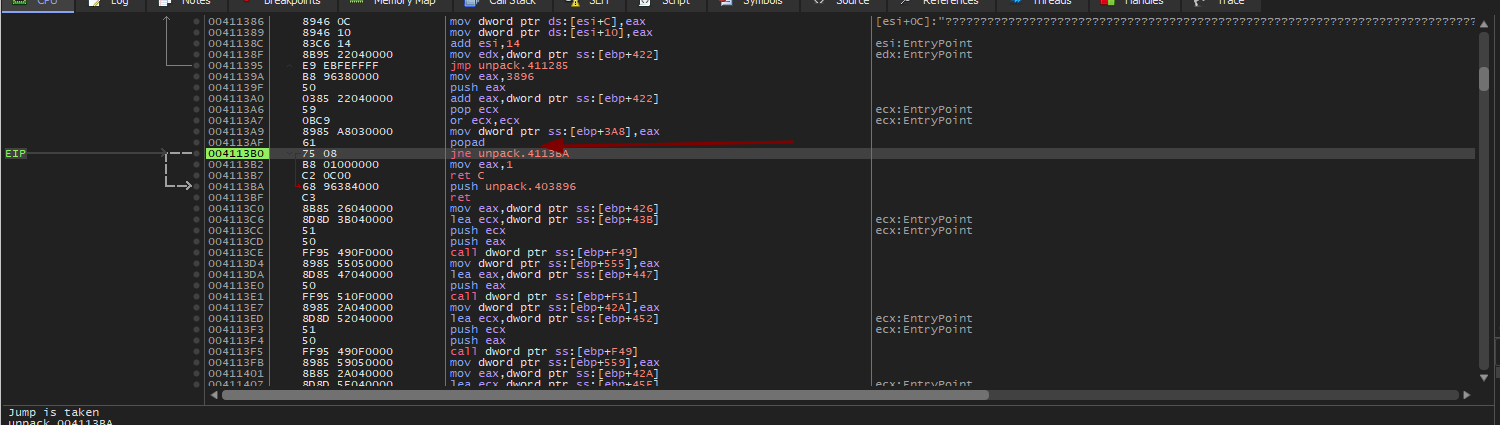
The debugger pauses, and we land right after the popad instruction. We’re almost out of the woods.
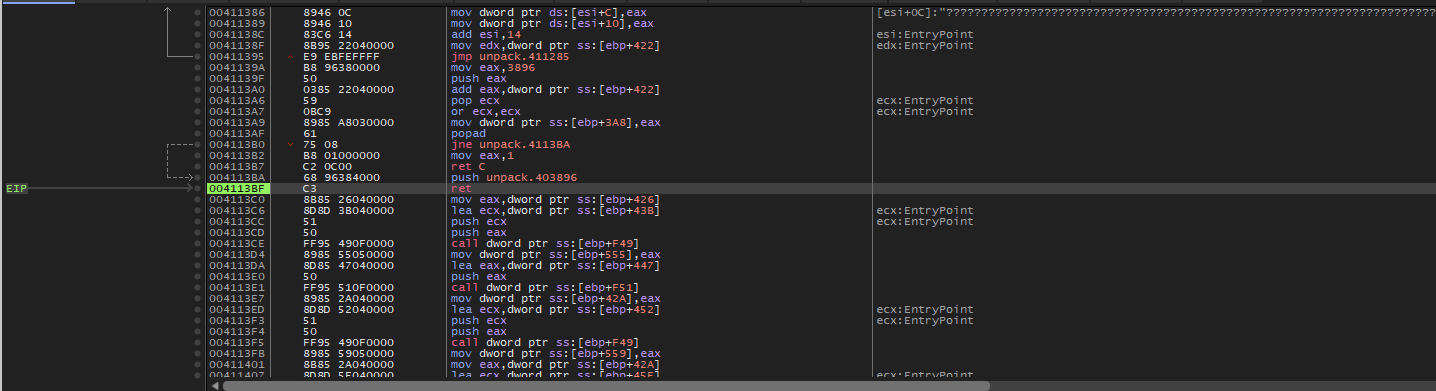
Stepping through the next few instructions (usually a RET or a massive JMP), we are transported to a completely different memory section. The address jumps wildly from where we were, indicating we’ve officially crossed over into the unpacked payload. Welcome to the Original Entry Point!
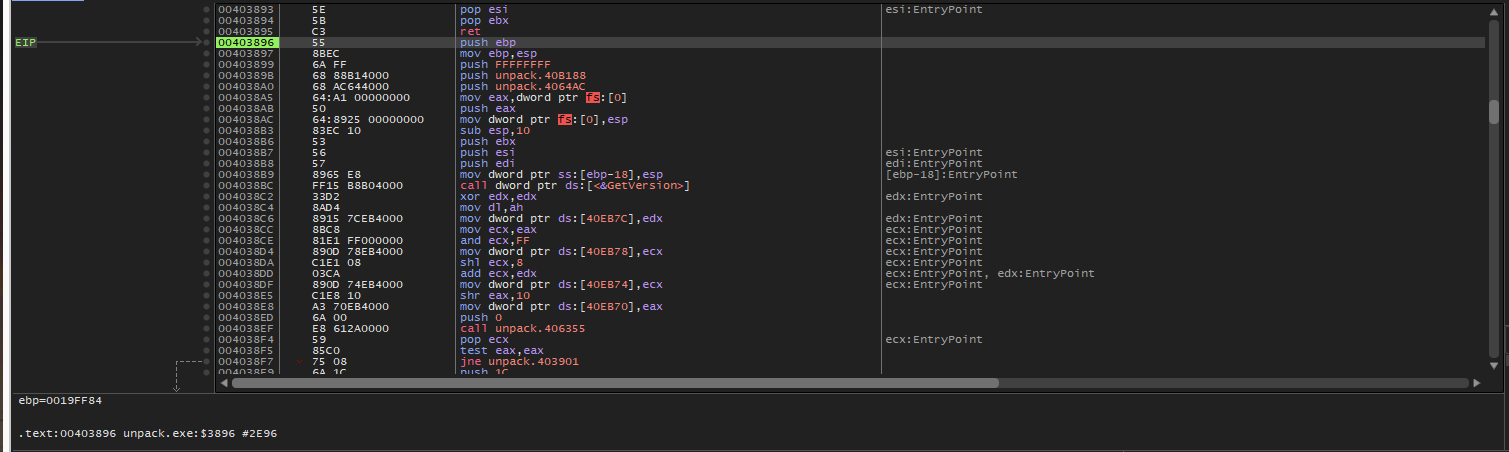
To prove we’ve struck gold and actually found the OEP, we need to extract this unpacked code from memory and rebuild it into a working executable. Enter Scylla (that little ‘S’ icon in the x32dbg toolbar).
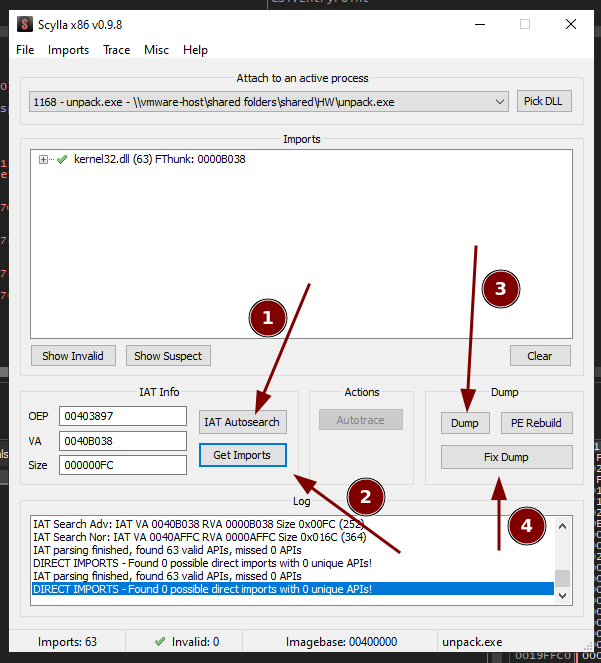
Here is how we rebuild the binary:
- IAT Autosearch: First, we click on “IAT Autosearch” to force Scylla to scan the memory around our current OEP to locate the Import Address Table (IAT). This is essentially the phonebook the malware uses to call Windows APIs.
- Get Imports: Then, we click “Get Imports” to tell Scylla to parse that IAT and list out all the DLLs and functions the malware requires to run.
- Dump: Next, we click on “Dump” to rip the unpacked executable out of live memory and save it to our disk as a raw file.
- Fix Dump: Finally, for peace of mind and a functioning binary, we click “Fix Dump” to take our raw memory dump and patch in the reconstructed IAT, repairing the PE header so analysis tools can actually understand it.
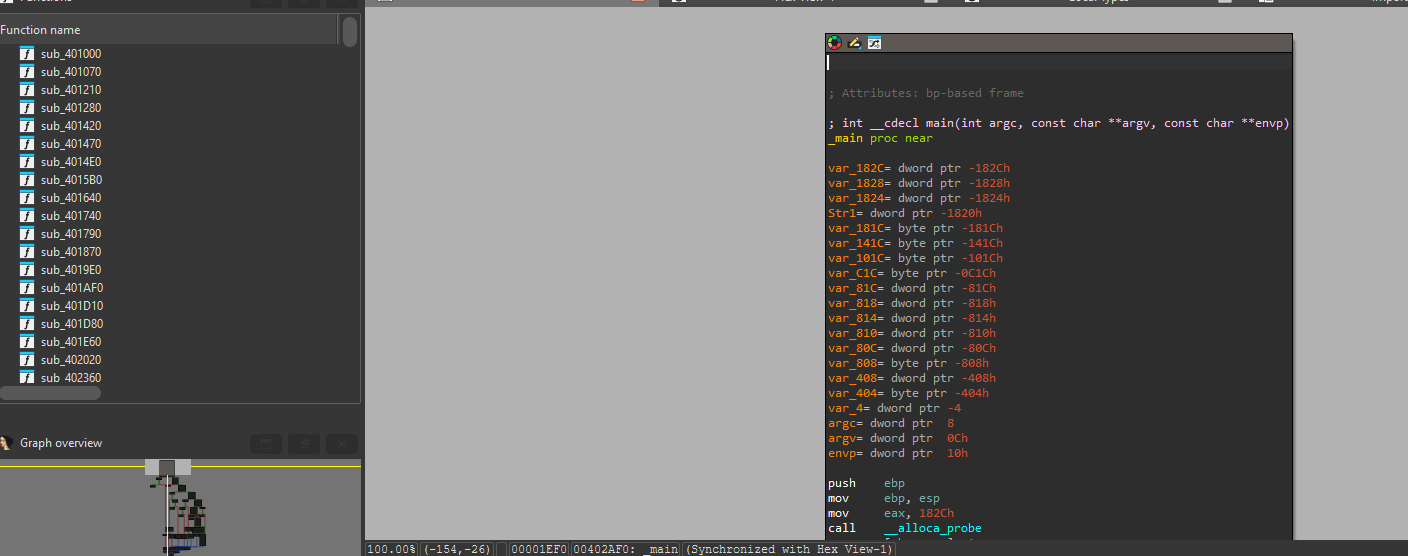
Throwing that fixed dump back into IDA Pro confirms our success. We land beautifully right before the main function.
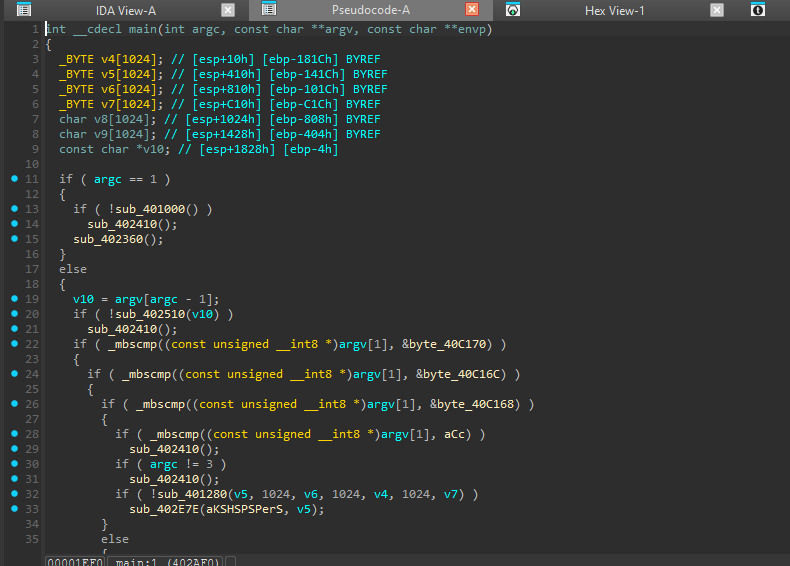 You can even hit
 F5 to admire the clean pseudocode. Not a bad day’s work!